Knowledge Center
Nearly Half of Georgia Households Struggle to Afford Basics, New Report Finds
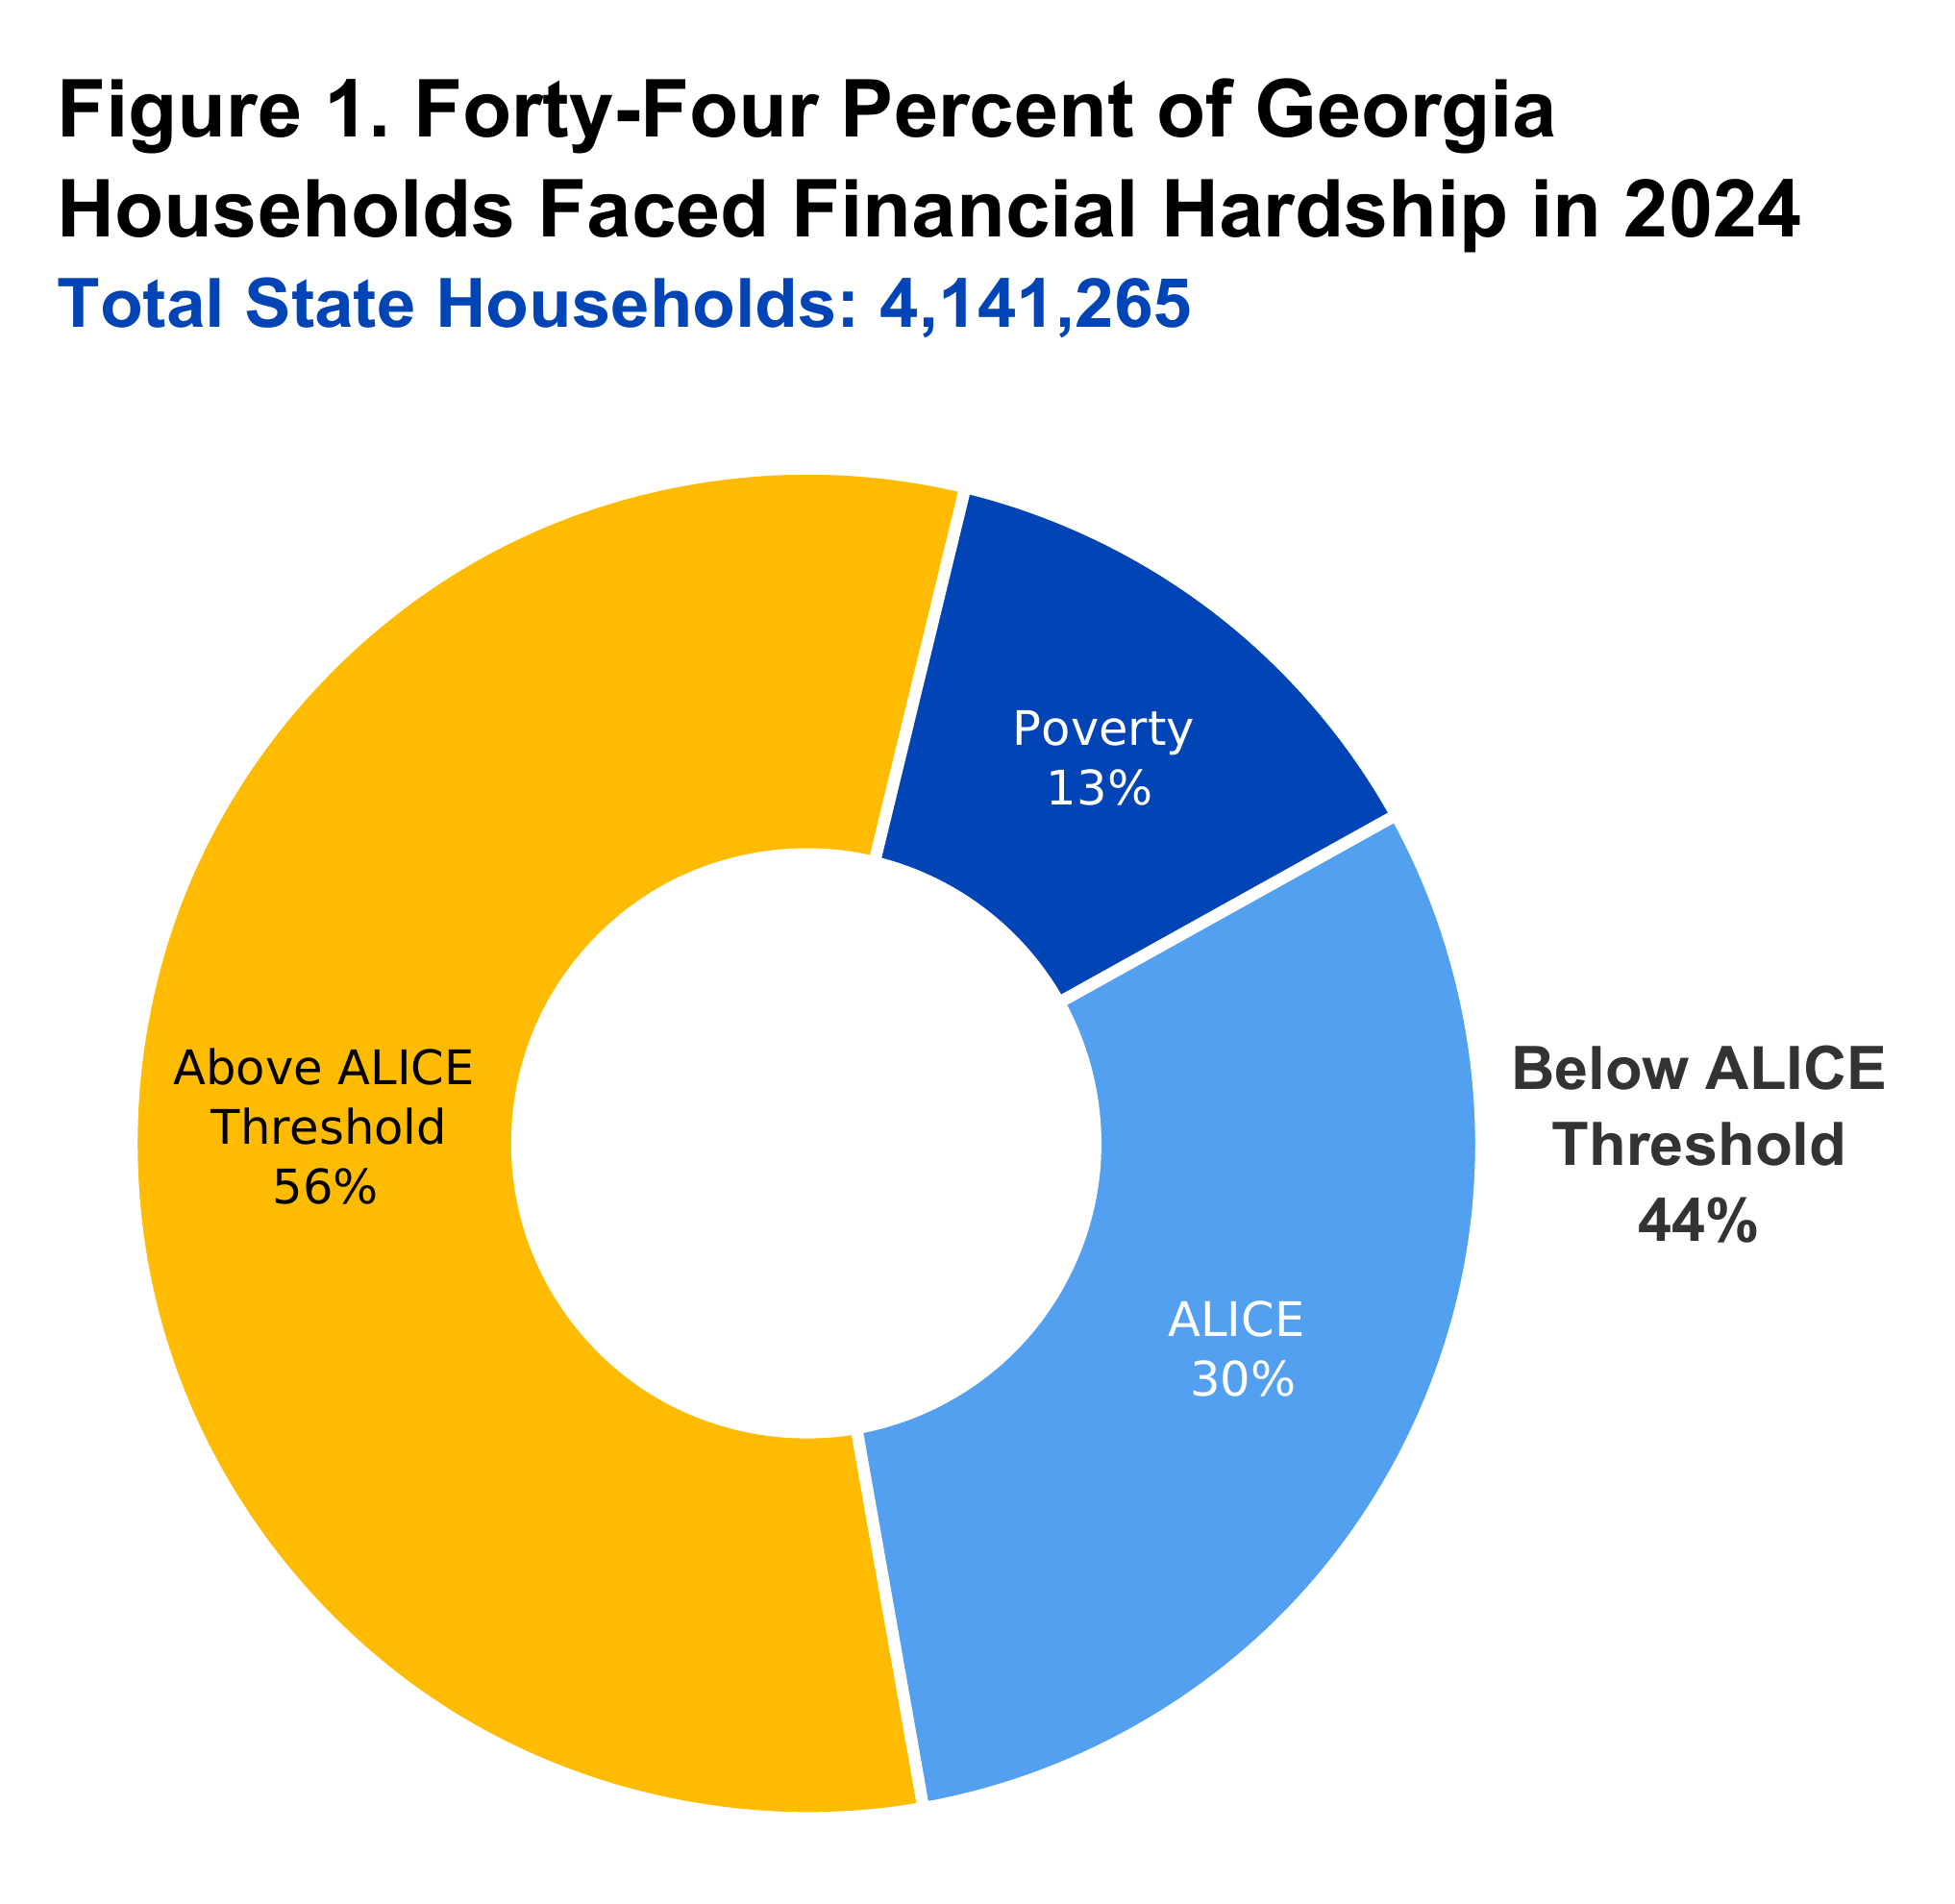
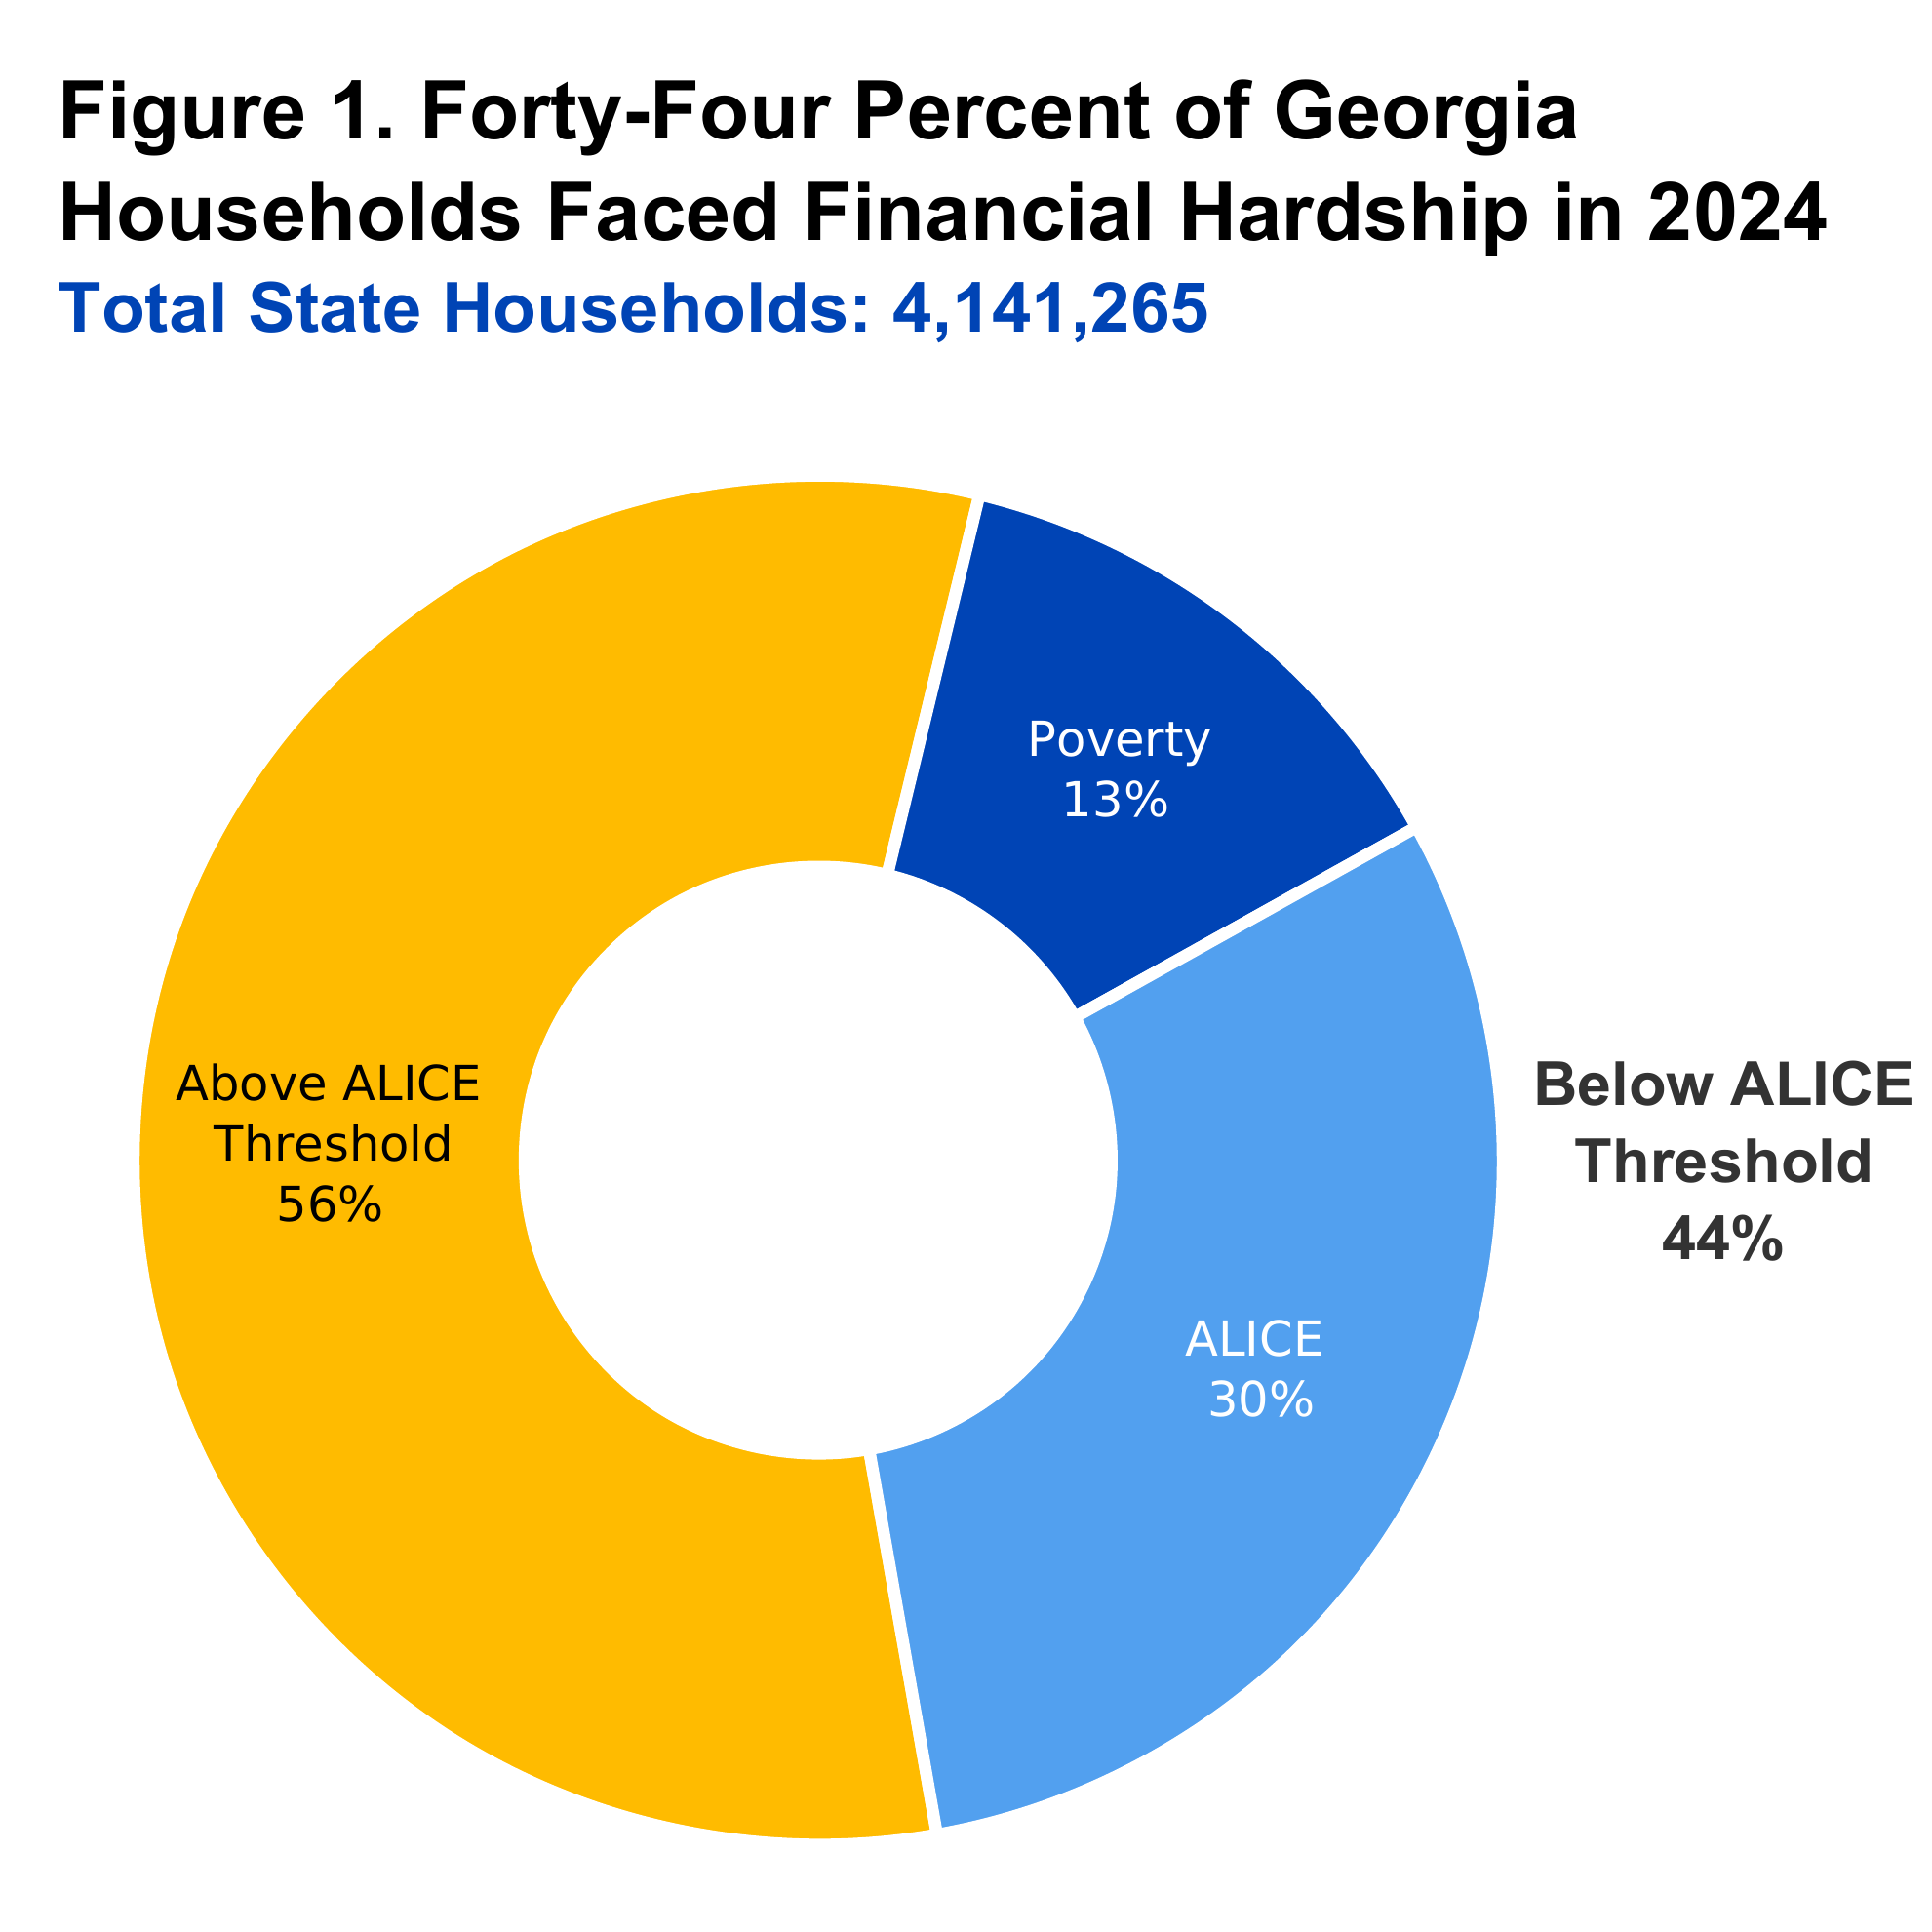
A new report from United Ways of Georgia shows that 44% of Georgia households did not earn enough to cover basic costs in 2024. That is more than 1.8 million households across the state.

SB 33: The Homeownership Opportunity and Market Equalization Act of 2026
The 2026 General Assembly passed Senate Bill 33, the Homeownership Opportunity and Market Equalization Act, making significant changes to how Georgia local governments may provide property tax relief to homeowners.
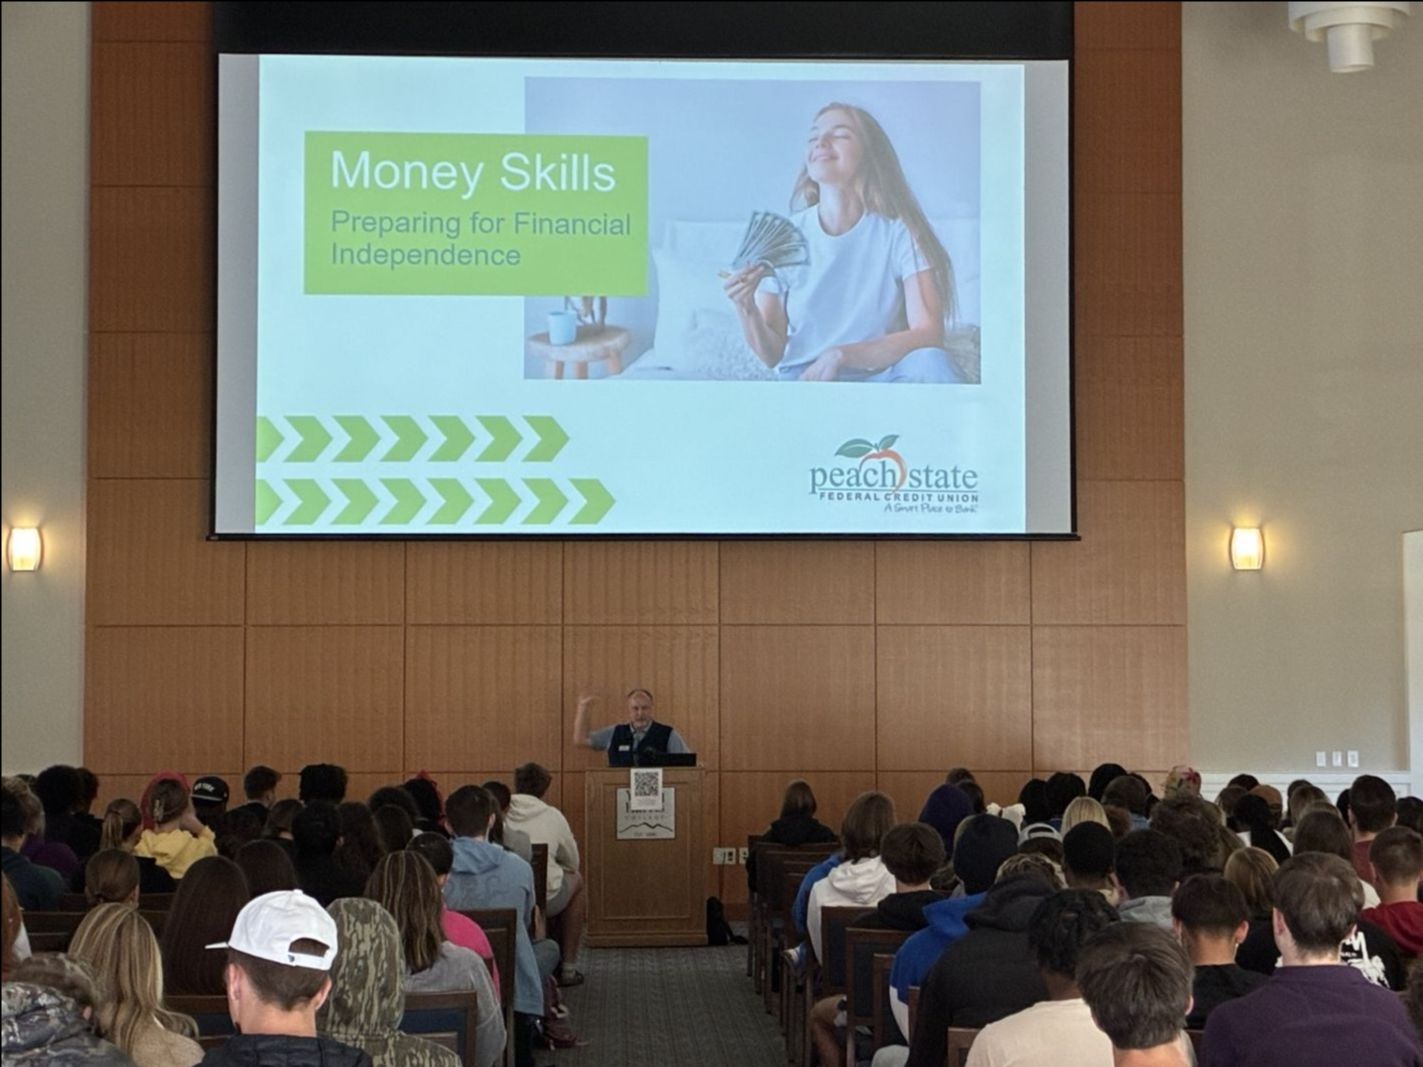
Young Harris Financial Literacy Engagement
As a rural and small Southern city conducting their master planning process, Young Harris leaders identified gaps in their community with financial literacy and security. Combining these challenges with a population comprising largely local college students, city leaders wanted to meet the unique needs of students and their community at large.

Ethics & Transparency
Article
Ethics Commission Shares Guidance on New PeachFile E-Filing Requirements
July 23, 2026
City officials should prepare for upcoming ethics filing changes by registering for PeachFile, understanding new filing requirements, and taking advantage of available training.

Ethics & Transparency | Public Relations, Communications & Branding | Social Media
Article
Social Media and Public Officials
July 18, 2026
Social media has become an everyday tool for city officials to share updates, highlight events, and respond to residents. But recent court decisions make clear that this convenience comes with legal risk. And that personal accounts can, under certain circumstances, be treated as an official government forum subject to First Amendment protections.
Economic Development | Housing | Infrastructure
Article
NLC Releases State of the Cities 2026 Report
July 13, 2026
According to the National League of Cities' 13th annual State of the Cities report, local governments across the country are navigating real pressures this year, from economic uncertainty to infrastructure needs, housing shortages, and rising public health and safety concerns.
Demographics | Economy
Article
Nearly Half of Georgia Households Struggle to Afford Basics, New Report Finds
July 06, 2026
A new report from United Ways of Georgia shows that 44% of Georgia households did not earn enough to cover basic costs in 2024. That is more than 1.8 million households across the state.

Taxation
Article
SB 33: The Homeownership Opportunity and Market Equalization Act of 2026
June 08, 2026
The 2026 General Assembly passed Senate Bill 33, the Homeownership Opportunity and Market Equalization Act, making significant changes to how Georgia local governments may provide property tax relief to homeowners.